Abstract
Cryptocurrencies illustrate rapid technological transformation, market diversification, and growing adoption by investors. Clustering cryptocurrencies into homogeneous groups enables investors and portfolio managers to better understand and control risk transmission mechanisms and market co-movements, ultimately optimizing portfolio construction and enhancing risk-return management. This paper introduces a new Artificial Intelligence method, Dhouib-Matrix-MSTP (DM-MSTP), to cluster the cryptocurrencies market. At first, the correlation matrix between the whole thirty-five cryptocurrencies is converted as a distance matrix. At second, the DM-MSTP method is developed to present the minimum spanning tree joining the all thirty-five cryptocurrencies (as a topological representation). Finally and to help the decision-maker, the minimum spanning tree represented by DM-MSTP can be used to cluster the cryptocurrencies by groups.
1 Introduction
Over the past decade, the cryptocurrency market has evolved from a niche technological innovation into a globally integrated financial ecosystem characterized by extreme volatility, structural complexity, and nonlinear interdependencies. The rise of decentralized finance (DeFi), stable coins, and blockchain-based tokens has expanded the digital asset universe while introducing new challenges related to market efficiency, risk management, and portfolio optimization. Traditional econometric models have often proved insufficient for capturing the nonlinear dynamics, structural dependencies, and fast-changing correlations inherent to cryptocurrency markets. This complexity calls for innovative analytical approaches that combine the interpretability of network theory with the adaptability of artificial intelligence.
The growing academic research on correlation-based networks, particularly the Minimum Spanning Tree (MST) approach pioneered by Mantegna (1999), has demonstrated the value of filtering noisy correlations and revealing the hierarchical structure of financial markets. However, despite the extensive use of MST in analyzing traditional markets, its integration into digital asset optimization frameworks remains underdeveloped. At the same time, artificial intelligence (AI) and machine learning (ML) models have achieved remarkable success in forecasting and optimizing financial portfolios. Yet, these models often prioritize predictive performance over structural understanding, limiting their interpretability and robustness in highly volatile environments such as the cryptocurrency market.
This study aims to bridge these two analytical paradigms by introducing an innovative optimization method, namely, Dhouib Matrix-Minimum Spanning Tree Problem (DM-MSTP). Basically, DM-SPP is designed in (Dhouib, 2024) to generate the shortest tree joining all nodes in a network. In this paper, DM-MSTP is used which integrates network topology derived from correlation structures with AI-driven optimization procedures. The primary objective of this research is to cluster the cryptocurrency market structure by enhancing portfolio resilience, interpretability, and adaptive learning capacity. Specifically, the study seeks to determine how MST-based structural information can be embedded within an AI optimization model to improve performance metrics across multiple cryptocurrencies.
Despite the rapid expansion of research in both network finance and AI-based portfolio models, several critical research gaps remain. First, existing studies rarely integrate MST network properties with AI optimization techniques in a unified, data-driven framework. Second, the robustness of MST applications in handling incomplete or irregular cryptocurrency datasets remains underexplored, despite the prevalence of missing or inconsistent trading histories.
Third, comparative assessments between network-based AI portfolios and conventional optimization methods (e.g., mean–variance or shrinkage estimators) are scarce, leaving the relative performance of hybrid approaches largely untested.
Accordingly, this study addresses the following research questions:
How can MST-based network representations be effectively integrated with AI-driven optimization to enhance portfolio efficiency in cryptocurrency markets?
And how can the structural insights derive from correlation networks improve the interpretability and robustness of AI-based financial decision models?
Considerable research examines the dynamics of cryptocurrency markets, with particular emphasis on highly capitalized and high-risk assets such as Bitcoin and Ethereum. However, limited attention has been devoted to the clustering of cryptocurrencies despite the growing heterogeneity in their characteristics, technological foundations, and market behaviors. This paper contributes to the literature by filling this gap and clustering 35 different cryptocurrencies over the period 2018– using the DM-MSTP method. This approach provides a more comprehensive understanding of market segmentation within digital assets and uncovers shared performance and risk patterns across cryptocurrency groups. Indeed, this paper presents the first application of DM-MSTP to cryptocurrencies (Basically, DM-MSTP is used to generate the shortest spanning tree for a graph).
The contribution of this research lies in its methodological innovation and practical relevance. By embedding artificial intelligence directly within the MST network topology, the proposed DM-MSTP framework not only enhances model performance but also provides a transparent representation of inter-cryptocurrency dependencies. This study enriches the emerging literature on intelligent financial systems by offering policymakers, investors, and portfolio managers a reliable and interpretable decision-support tool for navigating the complex and evolving landscape of digital assets.
The remainder of this paper is structured as follows: Section 2 reviews the relevant literature on MST applications and AI-based portfolio optimization. Section 3 describes the dataset and the methodological design of the DM-MSTP model. Section 4 presents the empirical analysis and results, while Section 5 concludes with theoretical implications, managerial insights, and recommendations for future research.
2 Literature review
Since Mantegna’s (1999) pioneering work, the analysis of financial market interdependencies through correlation-based networks has garnered considerable attention. By introducing the Minimum Spanning Tree (MST), Mantegna provided a concise and structured representation of market structure that filters noise from large correlation matrices while preserving the most significant asset connections through the minimization of total pairwise distances. This approach provides an interpretable, low-dimensional representation of market hierarchies and sectoral clustering. Building on this framework, further studies such as Tumminello et al. (2010) showed that financial MSTs exhibit evolving, non-random topologies reflecting market integration and systemic risk. Structural shifts in the MST often precede or coincide with major market events, highlighting its potential as an analytical tool for capturing the dynamic interdependencies of complex financial systems.
The rapid growth of digital assets has led to increased use of network theory and correlation-based methods in financial and cryptocurrency markets. Cryptocurrency minimum spanning trees (MSTs) exhibit distinct structural characteristics compared to traditional markets, including higher correlation volatility, faster topology changes, and the central dominance of major nodes such as Bitcoin and Ethereum (Kwapień et al., 2020; Sensoy and Tabak, 2022). Recent studies show that cryptocurrencies tend to form dynamic clusters based on their use cases as payments, DeFi, or stablecoins and that these clusters can rapidly reorganize in response to speculative trends or regulatory events. The MST approach offers valuable insights into the evolving structure and interdependencies of digital assets, particularly during periods of market turbulence. Nevertheless, the existing literature emphasizes the importance of careful data preprocessing, including cleaning and managing missing values, due to the irregular trading histories of many tokens (Naifar and Makni, 2025; Alnami et al., 2025; Alsini et al., 2024; Tumminello et al., 2010).
At its core, the Minimum Spanning Tree (MST) acts as a powerful organizational map, allowing us to peer into a complex financial system. By leveraging network theory, researchers have optimized investment portfolios by zeroing in on assets that barely correlate with others the “outliers” effectively enhancing diversification and correcting and correcting common risk-measurement errors. Classic studies by Onnela et al. (2003) and Pozzi et al. (2013) alongside newer crypto applications from Berouaga et al. (2023) and Jing (2023), have repeatedly proven that portfolios built this way can significantly outperform simpler or traditional mean-variance methods, especially when managing vast amounts of data. However, there’s a crucial catch: most of the existing frameworks are still too rigid. They rely on static market views or simple, fixed weights and rarely include vital checks to ensure the network structure holds up across different timeframes, distance metrics, or moments of market instability. This lack of robustness severely limits their potential to adapt and learn when integrated with modern Artificial Intelligence techniques.
Applying this MST lens specifically to digital assets, we uncover unique, structurally distinct patterns completely different from traditional finance. We see, for instance, a much higher correlation volatility, and key players like Bitcoin and Ethereum hold a strong, unchallenged central position over the entire network (Kwapień et al., 2021; Sensoy et al., 2021). This specific finding transforms MST-based clustering into an indispensable tool for the modern crypto investor. It provides a systematic means of identifying the assets that are loosely or entirely disconnected from the network’s major central nodes. By identifying these uncorrelated opportunities, managers can substantially improve diversification and achieve more stable risk estimates. Indeed, recent evidence consistently confirms that portfolios built using this network-based perspective tend to outperform those relying on older strategies (Berouaga et al., 2023; Jing, 2023). The true value of clustering is that it transforms the chaotic, high-dimensional structure of the crypto market into a clear, interpretable analytical framework, which is essential for making well-founded and transparent decisions in this rapidly evolving financial universe.
In parallel with network-based approaches, artificial intelligence and machine learning techniques, such as random forests, support vector machines, deep neural networks, and reinforcement learning, have been increasingly employed in portfolio optimization, particularly for modeling the nonlinear and high-frequency dynamics of cryptocurrency markets (Kurosaki and Kim, 2022; Sahu et al., 2024; Chen et al., 2025). However, most existing models place greater emphasis on predictive performance while paying limited attention to the structural information embedded in correlation networks. The integration of MST-based network topology with AI-driven optimization remains limited, despite its potential to combine interpretability with adaptive modeling capabilities.
The review of the literature reveals three key research gaps. First, integrated frameworks that merge MST-based market topology with intelligent optimization methods remain scarce, as most studies treat network analysis and portfolio construction as separate processes. Second, robustness considerations, such as the treatment of missing data, the choice of distance metrics, and the modeling of time-varying correlations, are insufficiently explored, despite their importance given the volatile and incomplete nature of cryptocurrency datasets. Third, comparative evaluations against advanced optimization techniques, including shrinkage estimators and machine learning-based portfolios, are limited, leaving the relative effectiveness of MST-guided strategies inadequately assessed.
The Dhouib–Matrix Minimum Spanning Tree Problem (DM-MSTP) approach introduced in this study addresses these gaps by integrating AI-driven optimization within the MST network structure. By combining the structural insights derived from correlation networks with intelligent asset selection and weighting mechanisms, the proposed method supports a more adaptive and robust portfolio construction process. This integration provides a novel framework illustrating how network science and artificial intelligence can jointly enhance performance, stability, and interpretability in cryptocurrency markets.
3 Data and methodology
The novel Dhouib-Matrix-MSTP (DM-MSTP) method is designed by the first author in Dhouib (2024) to optimize the shortest spanning tree for a network. In this paper DM-MSTP is used to present the topology of cryptocurrencies as a minimum spanning tree. DM-MSTP is an optimal method presenting a time complexity of O(n*log(n)) with n the number of vertices and its efficiency is proved by its comparison to six developed methods in the literature.
DM-MSTP is column-row (see Figure 1) method using an Adjacency-Matrix with two additional lists (Min-Columns and MST-Path). In fact, the Min-Columns list is used to archive the minimum value by columns. Whereas, the MST-Path list is used to record the minimum spanning component. A detailed a step-by-step application of DM-MSTP is presented in Dhouib (2024).
FIGURE 1
Besides, DM-MSTP is studied to illustrate the minimum spanning tree under interval-valued Fermatean neutrosophic environment in Dhouib et al. (2024). In fact, DM-MSTP is a component of the general concept of Dhouib-Matrix (DM) under which different methods are developed: The DM-SPP to plan the shortest trajectory for an autonomous mobile robot (Dhouib, 2026; Dhouib, 2025a), the DM-TP1 heuristic to generate the transportation plan in Dhouib et al. (2025a), the DM4 metaheuristic to optimize the movement of drilling robot arm in Dhouib (2025b) and the DM-TSP1 greedy technique to create the shortest Hamiltonian cycle in Dhouib et al. (2025b).
In this paper, the website (https://coinmarketcap.com/) is used to extract closing price data for thirty-five cryptocurrencies since their starting date (where for some cryptocurrencies, their starting date was 2013). Taking into account that these cryptocurrencies present different starting dates, the sample of closing price indices is selected from the starting date 01/11/2018 to the ending date 01/09/2025 with a monthly frequency. In addition, several modifications are generated, the data is reduced to 84 rows (for the 35 indices) and for missing data the average by column is added. For example, 18 missing data are in column SOL and filled with the SOL average, 23 missing data are filled with the average for column AVAX, 11 averages for HBAR, 7 average for LEO, 2 for CRO, 27 for SHIB, 22 for DOT, 13 for DAI, 23 for UNI, 6 for ENA and 6 average for OKB).
In this study, we focus on assets that capture the dominant structure and diversity of the global crypto market. The sample includes the largest and most liquid coins (BTC, ETH, SOL), major stablecoins (USDT, USDC, DAI, USDe), widely traded ecosystem and smart-contract platforms (ADA, AVAX, DOT) as well as high-volume (DOGE, SHIB) and key DeFi tokens (AAVE, UNI). It also incorporates privacy coins (XMR), exchange tokens (OKB, CRO), and new emerging assets with increasing market relevance (HYPE, ENA). Together, these cryptocurrencies represent the overwhelming majority of global market capitalization and trading activity during the study period, ensuring that the dataset reflects the market core and covers a broad spectrum of asset categories.
Table 1 reports the descriptive characteristics of the cryptocurrencies under study, including their mean values, standard deviations, and corresponding figures illustrating their price variations.
TABLE 1
| Num | Code | Currency | Mean | SD | Variations |
|---|---|---|---|---|---|
| 1 | BTC | Bitcoin | 22,495.3217 | 29,250.9009 | 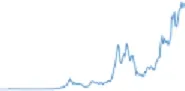 |
| 2 | ETH | Ethereum | 1,305.2456 | 1,305.4153 | 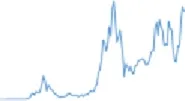 |
| 3 | USDT | Tether | 0.9997 | 0.0097 |  |
| 4 | XRP | XRP | 0.5044 | 0.6543 | 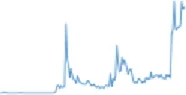 |
| 5 | BNB | BNB | 260.3987 | 252.9087 | 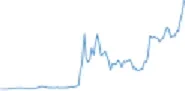 |
| 6 | SOL | Solana | 85.4182 | 73.4350 | 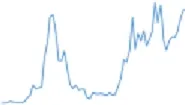 |
| 7 | USDC | USDC | 1.0007 | 0.0092 | 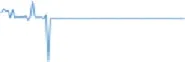 |
| 8 | DOGE | Dogecoin | 0.0612 | 0.0910 | 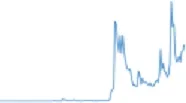 |
| 9 | TRX | TRON | 0.0839 | 0.0785 | 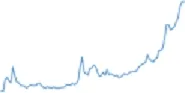 |
| 10 | ADA | Cardano | 0.5034 | 0.5153 | 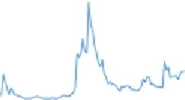 |
| 11 | HYPE | Hyperliquid | 29.5657 | 12.4371 | 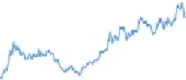 |
| 12 | LINK | Chainlink | 10.3445 | 8.8415 | 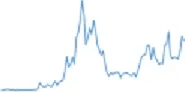 |
| 13 | USDe | USDe ethena USDe | 1.0003 | 0.0021 | 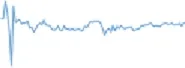 |
| 14 | AVAX | Avalanche | 30.5326 | 24.3986 | 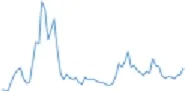 |
| 15 | SUI | Sui | 1.9120 | 1.3127 | 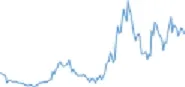 |
| 16 | XLM | Stellar | 0.1348 | 0.1331 | 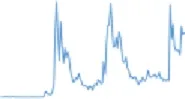 |
| 17 | BCH | Bitcoin cash | 421.2117 | 346.5040 | 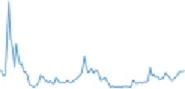 |
| 18 | HBAR | Hedera | 0.1219 | 0.0996 | 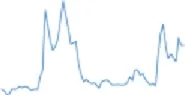 |
| 19 | LEO | UNUS SED LEO | 4.1435 | 2.6298 | 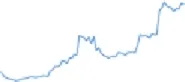 |
| 20 | LTC | Litecoin | 63.9455 | 55.5608 | 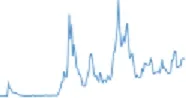 |
| 21 | CRO | Cronos | 0.1277 | 0.1177 | 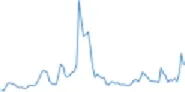 |
| 22 | SHIB | Shiba inu | 0.0000 | 0.0000 |  |
| 23 | TON | Toncoin | 3.0117 | 1.7680 |  |
| 24 | DOT | Polkadot | 11.2037 | 10.2354 |  |
| 25 | MNT | Mantle | 0.7877 | 0.2875 |  |
| 26 | XMR | Monero | 117.5495 | 95.9253 | 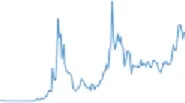 |
| 27 | DAI | DAI | 1.0001 | 0.0079 |  |
| 28 | WLFI | World liberty financial | 0.2139 | 0.0161 |  |
| 29 | UNI | Uniswap | 10.7389 | 7.7803 | 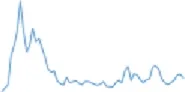 |
| 30 | IP | Story | 5.1113 | 1.9741 | 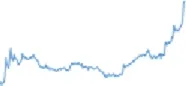 |
| 31 | ENA | Ethena | 0.5536 | 0.2659 | 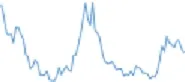 |
| 32 | AAVE | Aave | 169.4028 | 112.1361 | 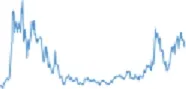 |
| 33 | PEPE | Pepe | 0.0000 | 0.0000 | 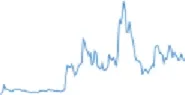 |
| 34 | OKB | OKB | 30.3000 | 30.5247 | 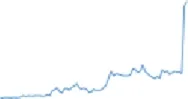 |
| 35 | NEAR | NEAR protocol | 4.4426 | 3.3803 | 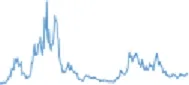 |
Descriptive characteristics of the cryptocurrencies.
Table 1 reveals distinct price dynamics across the 35 analyzed crypto assets. Similarly, mean returns differ substantially among various categories of cryptocurrencies. Assets such as Bitcoin (BTC) and Ethereum (ETH) exhibit the highest mean prices (22,495.32 and 1,305.25, respectively) and standard deviations (29,250.90 and 1,305.41), reflecting their market dominance, large capitalization, and heightened sensitivity to market-wide shocks. These findings are consistent with Corbet et al. (2018) and Koutmos (2018), who documented that Bitcoin plays a central role in driving systemic risk and information transmission within the cryptocurrency ecosystem. Moreover, altcoins such as BNB, SOL, and AVAX display relatively high mean values and considerable volatility. In contrast, stablecoins including USDT, USDC, and USDe maintain mean values close to one and minimal standard deviations, confirming their design as low-volatility assets. Emerging tokens such as PEPE and ENA exhibit lower price levels but moderate to high volatility. The observed dispersion in mean and standard deviation values across mature and emerging crypto assets highlights the importance of employing clustering methods to examine market segmentation and behavioral heterogeneity within the cryptocurrency market.
Table 2 reports correlation matrix across 35 cryptocurrencies after applying the log (1 + x) transformation.
TABLE 2
| | BTC | ETH | USDT | XRP | BNB | SOL | USDC | DOGE | TRX | ADA | HYPE | LINK | USDe | AVAX | SUI | XLM | BCH |
|---|---|---|---|---|---|---|---|---|---|---|---|---|---|---|---|---|---|
| BTC | 1.00 | 0.76 | 0.01 | 0.43 | 0.62 | 0.22 | 0.07 | 0.44 | 0.53 | 0.58 | 0.10 | 0.58 | 0.10 | 0.31 | 0.08 | 0.56 | 0.71 |
| ETH | 0.76 | 1.00 | −0.05 | 0.60 | 0.57 | 0.28 | −0.06 | 0.65 | 0.54 | 0.63 | −0.10 | 0.69 | 0.15 | 0.45 | 0.08 | 0.65 | 0.66 |
| USDT | 0.01 | −0.05 | 1.00 | 0.00 | 0.10 | −0.11 | 0.91 | 0.01 | −0.13 | 0.02 | 0.03 | −0.30 | 0.11 | 0.02 | −0.08 | −0.02 | 0.02 |
| XRP | 0.43 | 0.60 | 0.00 | 1.00 | 0.35 | 0.30 | 0.00 | 0.64 | 0.51 | 0.55 | −0.14 | 0.55 | 0.01 | 0.41 | −0.02 | 0.84 | 0.49 |
| BNB | 0.62 | 0.57 | 0.10 | 0.35 | 1.00 | 0.32 | 0.09 | 0.47 | 0.59 | 0.64 | −0.09 | 0.39 | 0.12 | 0.40 | 0.17 | 0.39 | 0.55 |
| SOL | 0.22 | 0.28 | −0.11 | 0.30 | 0.32 | 1.00 | −0.16 | 0.33 | 0.25 | 0.22 | −0.19 | 0.26 | 0.10 | 0.41 | 0.18 | 0.25 | 0.24 |
| USDC | 0.07 | −0.06 | 0.91 | 0.00 | 0.09 | −0.16 | 1.00 | 0.02 | −0.09 | 0.06 | 0.05 | −0.25 | 0.14 | 0.00 | −0.02 | −0.01 | 0.09 |
| DOGE | 0.44 | 0.65 | 0.01 | 0.64 | 0.47 | 0.33 | 0.02 | 1.00 | 0.33 | 0.56 | −0.20 | 0.49 | 0.10 | 0.49 | 0.03 | 0.64 | 0.53 |
| TRX | 0.53 | 0.54 | −0.13 | 0.51 | 0.59 | 0.25 | −0.09 | 0.33 | 1.00 | 0.44 | −0.04 | 0.51 | −0.08 | 0.28 | 0.10 | 0.42 | 0.42 |
| ADA | 0.58 | 0.63 | 0.02 | 0.55 | 0.64 | 0.22 | 0.06 | 0.56 | 0.44 | 1.00 | −0.18 | 0.52 | 0.06 | 0.50 | 0.07 | 0.75 | 0.46 |
| HYPE | 0.10 | −0.10 | 0.03 | −0.14 | −0.09 | −0.19 | 0.05 | −0.20 | −0.04 | −0.18 | 1.00 | −0.11 | 0.15 | −0.13 | 0.09 | −0.10 | 0.08 |
| LINK | 0.58 | 0.69 | −0.30 | 0.55 | 0.39 | 0.26 | −0.25 | 0.49 | 0.51 | 0.52 | −0.11 | 1.00 | −0.06 | 0.33 | 0.07 | 0.54 | 0.44 |
| USDe | 0.10 | 0.15 | 0.11 | 0.01 | 0.12 | 0.10 | 0.14 | 0.10 | −0.08 | 0.06 | 0.15 | −0.06 | 1.00 | 0.09 | 0.27 | −0.01 | 0.10 |
| AVAX | 0.31 | 0.45 | 0.02 | 0.41 | 0.40 | 0.41 | 0.00 | 0.49 | 0.28 | 0.50 | −0.13 | 0.33 | 0.09 | 1.00 | −0.09 | 0.42 | 0.31 |
| SUI | 0.08 | 0.08 | −0.08 | −0.02 | 0.17 | 0.18 | −0.02 | 0.03 | 0.10 | 0.07 | 0.09 | 0.07 | 0.27 | −0.09 | 1.00 | 0.01 | 0.10 |
| XLM | 0.56 | 0.65 | −0.02 | 0.84 | 0.39 | 0.25 | −0.01 | 0.64 | 0.42 | 0.75 | −0.10 | 0.54 | −0.01 | 0.42 | 0.01 | 1.00 | 0.54 |
| BCH | 0.71 | 0.66 | 0.02 | 0.49 | 0.55 | 0.24 | 0.09 | 0.53 | 0.42 | 0.46 | 0.08 | 0.44 | 0.10 | 0.31 | 0.10 | 0.54 | 1.00 |
| HBAR | 0.45 | 0.54 | −0.04 | 0.47 | 0.31 | 0.20 | −0.11 | 0.41 | 0.33 | 0.49 | −0.18 | 0.41 | −0.04 | 0.46 | −0.01 | 0.54 | 0.28 |
| LEO | 0.15 | 0.17 | 0.12 | 0.22 | 0.31 | 0.05 | 0.06 | 0.22 | 0.19 | 0.30 | −0.19 | −0.17 | 0.02 | 0.13 | 0.08 | 0.31 | 0.24 |
| LTC | 0.75 | 0.71 | −0.07 | 0.50 | 0.63 | 0.22 | 0.00 | 0.48 | 0.52 | 0.56 | −0.09 | 0.57 | −0.01 | 0.26 | 0.18 | 0.57 | 0.75 |
| CRO | 0.38 | 0.44 | 0.01 | 0.27 | 0.44 | 0.14 | 0.02 | 0.26 | 0.18 | 0.45 | 0.02 | 0.21 | 0.23 | 0.43 | 0.15 | 0.42 | 0.40 |
| SHIB | 0.40 | 0.37 | 0.01 | 0.26 | 0.33 | 0.19 | 0.00 | 0.37 | 0.02 | 0.21 | −0.17 | 0.26 | 0.15 | 0.21 | −0.06 | 0.31 | 0.42 |
| TON | 0.04 | 0.13 | −0.02 | 0.23 | 0.02 | 0.08 | −0.07 | −0.01 | 0.14 | 0.07 | −0.03 | 0.19 | 0.14 | 0.03 | 0.26 | 0.15 | 0.06 |
| DOT | 0.63 | 0.60 | −0.26 | 0.41 | 0.50 | 0.38 | −0.26 | 0.55 | 0.35 | 0.70 | −0.07 | 0.47 | 0.20 | 0.59 | 0.14 | 0.60 | 0.48 |
| MNT | −0.02 | 0.09 | −0.09 | 0.02 | 0.08 | 0.16 | −0.09 | 0.08 | 0.04 | 0.09 | 0.00 | −0.01 | 0.37 | 0.05 | 0.52 | 0.09 | 0.09 |
| XMR | 0.65 | 0.54 | 0.07 | 0.36 | 0.66 | 0.17 | 0.12 | 0.32 | 0.55 | 0.42 | 0.02 | 0.37 | 0.00 | 0.17 | 0.18 | 0.35 | 0.62 |
| DAI | 0.01 | −0.11 | 0.90 | −0.02 | 0.05 | −0.09 | 0.91 | −0.03 | −0.15 | 0.04 | 0.05 | −0.26 | 0.13 | 0.01 | −0.02 | −0.02 | 0.04 |
| WLFI | −0.13 | −0.04 | −0.02 | 0.13 | −0.01 | −0.02 | −0.06 | −0.03 | 0.02 | −0.01 | −0.08 | 0.06 | −0.16 | 0.13 | −0.03 | −0.01 | −0.10 |
| UNI | 0.39 | 0.55 | 0.01 | 0.47 | 0.37 | 0.34 | 0.00 | 0.62 | 0.32 | 0.50 | −0.17 | 0.42 | −0.02 | 0.80 | −0.06 | 0.49 | 0.38 |
| IP | 0.01 | −0.11 | −0.09 | −0.09 | −0.07 | 0.00 | −0.09 | −0.14 | −0.11 | −0.09 | 0.32 | −0.08 | 0.03 | −0.01 | 0.02 | −0.09 | −0.01 |
| ENA | 0.15 | 0.20 | −0.13 | 0.10 | 0.08 | 0.17 | −0.17 | 0.05 | 0.08 | 0.10 | 0.10 | 0.15 | 0.09 | 0.01 | 0.51 | 0.10 | 0.19 |
| AAVE | 0.03 | 0.02 | 0.01 | −0.04 | 0.07 | 0.23 | 0.00 | 0.04 | 0.05 | 0.03 | 0.09 | −0.06 | 0.10 | 0.15 | 0.58 | 0.02 | 0.07 |
| PEPE | −0.07 | −0.05 | −0.01 | −0.01 | −0.06 | 0.01 | −0.05 | −0.11 | −0.05 | 0.07 | −0.03 | 0.01 | −0.22 | 0.02 | 0.14 | 0.04 | −0.03 |
| OKB | 0.01 | 0.02 | 0.10 | −0.01 | 0.22 | 0.12 | 0.13 | 0.03 | 0.00 | 0.17 | −0.05 | −0.02 | 0.21 | 0.18 | 0.27 | 0.04 | 0.02 |
| NEAR | 0.00 | 0.02 | −0.03 | −0.03 | −0.02 | 0.16 | −0.03 | 0.02 | 0.02 | 0.09 | 0.06 | 0.10 | 0.17 | 0.09 | 0.61 | −0.02 | 0.04 |
| HBAR | LEO | LTC | CRO | SHIB | TON | DOT | MNT | XMR | DAI | WLFI | UNI | IP | ENA | AAVE | PEPE | OKB | NEAR |
|---|---|---|---|---|---|---|---|---|---|---|---|---|---|---|---|---|---|
| 0.45 | 0.15 | 0.75 | 0.38 | 0.40 | 0.04 | 0.63 | −0.02 | 0.65 | 0.01 | −0.13 | 0.39 | 0.01 | 0.15 | 0.03 | −0.07 | 0.01 | 0.00 |
| 0.54 | 0.17 | 0.71 | 0.44 | 0.37 | 0.13 | 0.60 | 0.09 | 0.54 | −0.11 | −0.04 | 0.55 | −0.11 | 0.20 | 0.02 | −0.05 | 0.02 | 0.02 |
| −0.04 | 0.12 | −0.07 | 0.01 | 0.01 | −0.02 | −0.26 | −0.09 | 0.07 | 0.90 | −0.02 | 0.01 | −0.09 | −0.13 | 0.01 | −0.01 | 0.10 | −0.03 |
| 0.47 | 0.22 | 0.50 | 0.27 | 0.26 | 0.23 | 0.41 | 0.02 | 0.36 | −0.02 | 0.13 | 0.47 | −0.09 | 0.10 | −0.04 | −0.01 | −0.01 | −0.03 |
| 0.31 | 0.31 | 0.63 | 0.44 | 0.33 | 0.02 | 0.50 | 0.08 | 0.66 | 0.05 | −0.01 | 0.37 | −0.07 | 0.08 | 0.07 | −0.06 | 0.22 | −0.02 |
| 0.20 | 0.05 | 0.22 | 0.14 | 0.19 | 0.08 | 0.38 | 0.16 | 0.17 | −0.09 | −0.02 | 0.34 | 0.00 | 0.17 | 0.23 | 0.01 | 0.12 | 0.16 |
| −0.11 | 0.06 | 0.00 | 0.02 | 0.00 | −0.07 | −0.26 | −0.09 | 0.12 | 0.91 | −0.06 | 0.00 | −0.09 | −0.17 | 0.00 | −0.05 | 0.13 | −0.03 |
| 0.41 | 0.22 | 0.48 | 0.26 | 0.37 | −0.01 | 0.55 | 0.08 | 0.32 | −0.03 | −0.03 | 0.62 | −0.14 | 0.05 | 0.04 | −0.11 | 0.03 | 0.02 |
| 0.33 | 0.19 | 0.52 | 0.18 | 0.02 | 0.14 | 0.35 | 0.04 | 0.55 | −0.15 | 0.02 | 0.32 | −0.11 | 0.08 | 0.05 | −0.05 | 0.00 | 0.02 |
| 0.49 | 0.30 | 0.56 | 0.45 | 0.21 | 0.07 | 0.70 | 0.09 | 0.42 | 0.04 | −0.01 | 0.50 | −0.09 | 0.10 | 0.03 | 0.07 | 0.17 | 0.09 |
| −0.18 | −0.19 | −0.09 | 0.02 | −0.17 | −0.03 | −0.07 | 0.00 | 0.02 | 0.05 | −0.08 | −0.17 | 0.32 | 0.10 | 0.09 | −0.03 | −0.05 | 0.06 |
| 0.41 | −0.17 | 0.57 | 0.21 | 0.26 | 0.19 | 0.47 | −0.01 | 0.37 | −0.26 | 0.06 | 0.42 | −0.08 | 0.15 | −0.06 | 0.01 | −0.02 | 0.10 |
| −0.04 | 0.02 | −0.01 | 0.23 | 0.15 | 0.14 | 0.20 | 0.37 | 0.00 | 0.13 | −0.16 | −0.02 | 0.03 | 0.09 | 0.10 | −0.22 | 0.21 | 0.17 |
| 0.46 | 0.13 | 0.26 | 0.43 | 0.21 | 0.03 | 0.59 | 0.05 | 0.17 | 0.01 | 0.13 | 0.80 | −0.01 | 0.01 | 0.15 | 0.02 | 0.18 | 0.09 |
| −0.01 | 0.08 | 0.18 | 0.15 | −0.06 | 0.26 | 0.14 | 0.52 | 0.18 | −0.02 | −0.03 | −0.06 | 0.02 | 0.51 | 0.58 | 0.14 | 0.27 | 0.61 |
| 0.54 | 0.31 | 0.57 | 0.42 | 0.31 | 0.15 | 0.60 | 0.09 | 0.35 | −0.02 | −0.01 | 0.49 | −0.09 | 0.10 | 0.02 | 0.04 | 0.04 | −0.02 |
| 0.28 | 0.24 | 0.75 | 0.40 | 0.42 | 0.06 | 0.48 | 0.09 | 0.62 | 0.04 | −0.10 | 0.38 | −0.01 | 0.19 | 0.07 | −0.03 | 0.02 | 0.04 |
| 1.00 | 0.24 | 0.38 | 0.31 | 0.25 | 0.12 | 0.55 | 0.02 | 0.19 | −0.07 | 0.10 | 0.47 | 0.04 | 0.01 | −0.04 | 0.10 | 0.11 | −0.03 |
| 0.24 | 1.00 | 0.18 | 0.23 | 0.24 | 0.17 | 0.19 | 0.00 | 0.19 | 0.08 | −0.05 | 0.10 | −0.02 | 0.13 | 0.07 | 0.03 | 0.09 | −0.03 |
| 0.38 | 0.18 | 1.00 | 0.31 | 0.32 | 0.16 | 0.56 | 0.14 | 0.62 | −0.04 | −0.02 | 0.37 | −0.16 | 0.26 | 0.10 | −0.06 | 0.06 | 0.08 |
| 0.31 | 0.23 | 0.31 | 1.00 | 0.21 | −0.07 | 0.37 | 0.31 | 0.21 | 0.01 | −0.08 | 0.30 | 0.13 | 0.07 | 0.14 | −0.07 | 0.25 | 0.00 |
| 0.25 | 0.24 | 0.32 | 0.21 | 1.00 | 0.00 | 0.43 | −0.11 | 0.09 | 0.00 | 0.10 | 0.26 | −0.17 | −0.10 | −0.06 | −0.04 | 0.14 | −0.11 |
| 0.12 | 0.17 | 0.16 | −0.07 | 0.00 | 1.00 | 0.03 | 0.28 | 0.02 | 0.00 | 0.16 | 0.02 | −0.06 | 0.44 | 0.21 | −0.02 | −0.23 | 0.39 |
| 0.55 | 0.19 | 0.56 | 0.37 | 0.43 | 0.03 | 1.00 | 0.11 | 0.29 | −0.25 | −0.02 | 0.59 | 0.02 | 0.11 | 0.13 | −0.02 | 0.24 | 0.15 |
| 0.02 | 0.00 | 0.14 | 0.31 | −0.11 | 0.28 | 0.11 | 1.00 | −0.01 | −0.04 | −0.13 | 0.01 | −0.07 | 0.46 | 0.52 | 0.01 | 0.10 | 0.54 |
| 0.19 | 0.19 | 0.62 | 0.21 | 0.09 | 0.02 | 0.29 | −0.01 | 1.00 | 0.07 | −0.07 | 0.17 | 0.00 | 0.21 | 0.04 | 0.05 | 0.02 | −0.07 |
| −0.07 | 0.08 | −0.04 | 0.01 | 0.00 | 0.00 | −0.25 | −0.04 | 0.07 | 1.00 | 0.00 | 0.00 | −0.06 | −0.08 | −0.01 | 0.00 | 0.03 | 0.01 |
| 0.10 | −0.05 | −0.02 | −0.08 | 0.10 | 0.16 | −0.02 | −0.13 | −0.07 | 0.00 | 1.00 | 0.22 | −0.07 | 0.00 | −0.01 | 0.16 | 0.03 | −0.03 |
| 0.47 | 0.10 | 0.37 | 0.30 | 0.26 | 0.02 | 0.59 | 0.01 | 0.17 | 0.00 | 0.22 | 1.00 | −0.06 | 0.02 | 0.13 | 0.01 | 0.19 | 0.08 |
| 0.04 | −0.02 | −0.16 | 0.13 | −0.17 | −0.06 | 0.02 | −0.07 | 0.00 | −0.06 | −0.07 | −0.06 | 1.00 | −0.08 | 0.04 | 0.07 | 0.17 | 0.14 |
| 0.01 | 0.13 | 0.26 | 0.07 | −0.10 | 0.44 | 0.11 | 0.46 | 0.21 | −0.08 | 0.00 | 0.02 | −0.08 | 1.00 | 0.42 | 0.09 | −0.33 | 0.53 |
| −0.04 | 0.07 | 0.10 | 0.14 | −0.06 | 0.21 | 0.13 | 0.52 | 0.04 | −0.01 | −0.01 | 0.13 | 0.04 | 0.42 | 1.00 | 0.06 | 0.25 | 0.62 |
| 0.10 | 0.03 | −0.06 | −0.07 | −0.04 | −0.02 | −0.02 | 0.01 | 0.05 | 0.00 | 0.16 | 0.01 | 0.07 | 0.09 | 0.06 | 1.00 | 0.00 | 0.16 |
| 0.11 | 0.09 | 0.06 | 0.25 | 0.14 | −0.23 | 0.24 | 0.10 | 0.02 | 0.03 | 0.03 | 0.19 | 0.17 | −0.33 | 0.25 | 0.00 | 1.00 | 0.20 |
| −0.03 | −0.03 | 0.08 | 0.00 | −0.11 | 0.39 | 0.15 | 0.54 | −0.07 | 0.01 | −0.03 | 0.08 | 0.14 | 0.53 | 0.62 | 0.16 | 0.20 | 1.00 |
The correlation matrix across 35 cryptocurrencies.
The correlation analysis reveals a pronounced interconnectedness among major cryptocurrencies, highlighting the limited diversification potential within the market (see Figure 2). Bitcoin (BTC) exhibits strong positive correlations with leading alternative cryptocurrencies such as Ethereum (0.76), Litecoin (0.75), and Bitcoin Cash (0.71), underscoring its role as the dominant benchmark asset and primary transmitter of market-wide shocks. Ethereum’s strong association with other cryptocurrencies (BTC, LTC, BNB, LINK) further confirms that major cryptocurrencies tend to move in tandem, reflecting a high degree of market. In contrast, stablecoins such as USDT (0.01) and USDC (0.07) display near-zero correlations with all other assets, consistent with their design to maintain price stability and serve as hedging instruments against market turbulence. ENA shows low but positive correlations with BTC (0.15) and ETH (0.20), suggesting partial sensitivity to systemic trends while retaining a degree of idiosyncratic behavior. Conversely, UNI (Uniswap) demonstrates moderate to strong correlations with key cryptocurrencies such as ETH (0.55), BNB (0.47), and DOGE (0.62), indicating its price dynamics are closely aligned with the overall market dynamic. Collectively, these findings suggest that large capitalization cryptocurrencies operate within a highly synchronized network and a segmentation between speculative and stability-oriented crypto assets.
FIGURE 2
Each index is presented at a separate node, with vertices representing relationships between them and presenting a weighted extracted from the correlation matrix () using the above Equation 1.
Using the distance matrix (see Figure 3), the DM-MSTP can generate the topologies for the thirty-five cryptocurrencies. Figure 4 reports the minimum spanning tree with a minimum distance of 31.424 using the DM-MSTP.
FIGURE 3
FIGURE 4
The minimum spanning tree (shown in Figure 4), is generated for 35 cryptocurrencies based on their return correlation (price). In this structure, each node represents a crypto asset, and each link signifies a correlated price relationship. The MST is constructed to capture the minimum total distance (maximum correlation) among assets, often utilizing a rolling window for dynamic analysis.
Cryptocurrencies like NEAR, MNT, CRO, ADA, XLM, ETH, and BTC serve as central hubs, connecting various other assets and clusters, which highlights their broad influence in the market. Assets exhibiting short edges and being in close proximity demonstrate strong co-movement and high correlation, suggesting their returns are highly dependent and offer limited diversification benefits. For example, DAI, USDT, and USDC form a tight cluster due to their similar behavior as stablecoins. The results also underscore the systemic importance of BTC (Bitcoin), which is centrally linked to other major assets such as LTC, XMR, and ETH. Therefore, for effective portfolio diversification, managers should include cryptocurrencies that are far apart in the tree or connected by longer paths, as these assets exhibit lower correlation and can better reduce overall portfolio risk.
Other artificial intelligence tools can be used. Figure 5 illustrates the generated dendrogram for the 35 cryptocurrencies thanks to the agglomerative hierarchical clustering using “scipy” library. Four groups can be easily differentiated by the orange, green, red and purple colors (see Figure 5). Where the smallest group (green) is composed of only three cryptocurrencies (USDT, USDC and DAI). Followed by the second small group (red) with six cryptocurrencies (MNT, SUI, AAVE, NEAR, TON, ENA). Then the third group (purple) with nine elements (LEO, SHIB, USDe, CRO, OKB, HYPE, IP, WLFI and PEPE) and the remaining indices (seventeen) in the fourth group (orange).
FIGURE 5
4 Analysis
The elevated volatility and proliferation of diverse cryptocurrencies underscore the complex influence of various drivers on the crypto ecosystem, from investor psychology and technological development to evolving regulatory frameworks. This environment necessitates a rigorous investigation for the purpose of clustering these digital assets. The findings of this study will empower investors and portfolio managers to discern otherwise concealed market patterns, ultimately refining their practices in risk management and portfolio diversification.
The minimum spanning tree joining the thirty-five cryptocurrencies can be created and graphically represented thanks to DM-MSTP (see Figure 4). Besides, to help the decision-maker this minimum spanning tree can be subdivide into two, three or even four groups.
4.1 The minimum spanning tree (MST): two clusters
The Minimum Spanning Tree (MST) derived using the DM-MSTP algorithm for 35 cryptocurrencies reveals a clear division of the market into two distinct clusters. Group A represents the first cluster, comprising stablecoins such as USDT, USDC, DAI, and USDe, along with several DeFi and emerging tokens including AAVE, NEAR, PEPE, and TON. This cluster exhibits strong internal linkages, reflecting the assets’ shared low volatility and structural dependence on fiat-pegged mechanisms or decentralized finance frameworks. Group B, by contrast, represents the second cluster and includes major high-capitalization cryptocurrencies such as BTC, ETH, XMR, and BCH, which demonstrate pronounced interconnectedness and synchronized movements. The analysis indicates that Bitcoin and Ethereum function as central hubs within this network, underscoring their key role in transmitting volatility and information across the crypto market. Moreover, the presence of bridging nodes such as CRO highlights the integrative function of intermediary assets that connect the stable and volatile segments of the cryptocurrency ecosystem. Figure 6 shows the results of the Minimum Spanning Tree derived using the DM-MSTP with two groups.
FIGURE 6
4.2 The minimum spanning tree (MST): three clusters
Figure 7 presents the results of the Minimum Spanning Tree (MST) derived using the DM-MSTP algorithm, illustrating the formation of three distinct groups. Based on the provided Minimum Spanning Tree (MST) visualization, which maps cryptocurrency return correlation, the 35 assets cluster into distinct groups offering critical insights for portfolio management. Assets within the tight Group B, notably BTC and ETH, act as central hubs, linked to a large systemic network including LTC, LINK, and ADA, signifying extremely high co-movement and limited internal diversification potential. In contrast, Group C contains the stablecoins DAI, USDT, and USDC, which form an almost perfectly correlated anchor with little volatility, serving as a low-risk component for capital preservation rather than growth. Group A, featuring assets like NEAR, SUI, and TON, is structurally separated, indicating a lower correlation with the systemic risks of Group B, making it the primary source for diversification benefits. A manager should therefore seek to maximize the distance between chosen assets on the tree, for example, pairing an asset from the highly correlated BTC/ETH core with an asset from the distinct Group A (like TON) and a stablecoin from Group C to construct a well-diversified portfolio that effectively mitigates overall risk.
FIGURE 7
4.3 The minimum spanning tree (MST): four clusters
Figure 8 presents the results of the Minimum Spanning Tree (MST) derived using the DM-MSTP algorithm, illustrating the formation of four distinct groups. Consistent with the findings of Lorenzo and Arroyo (2022), who show that the cryptocurrency market is typically segmented into a small number of clusters (five or fewer), we adopt four clusters to capture distinct financial performance patterns.
FIGURE 8
The Minimum Spanning Tree (MST) generated using the DM-MSTP algorithm for 35 cryptocurrencies reveals a clear segmentation of the market into four distinct groups, highlighting the heterogeneous nature of the cryptocurrency ecosystem. Group A includes emerging and DeFi-oriented tokens such as AAVE and PEPE, along with exchange tokens like OKB representing the innovation-driven segment centered on decentralized ecosystems. Group B comprises mature cryptocurrencies such as BTC, XMR, and BCH, reflecting the core of the traditional crypto market. Group C consists of low-volatility assets including USDT, USDC, DAI, and USDe, whose strong internal correlations stem from their common peg to the U.S. dollar. Group D encompasses a larger set of major assets such as ETH, DOGE, XLM, and SOL, forming a broad cluster of highly traded, market-sensitive cryptocurrencies.
Obviously, Bitcoin (BTC) emerges as a central hub linking Groups B and D, confirming its role as the principal transmitter of shocks and information across the network. Additionally, the bridging node CRO connects liquidity-driven assets from Group A to the high-volatility assets in Group D, emphasizing the functional interdependence between decentralized finance protocols and mainstream cryptocurrencies. These results indicate that the cryptocurrency market can be segmented into clusters based on their market characteristics, such as volatility. Moreover, Bitcoin acts as a significant transmitter of information across these clusters. These results confirm those found by Lorenzo and Arroyo (2022) that the cryptocurrency market can be broadly divided into a limited number of clusters, typically fewer than five. Furthermore, the analysis reveals meaningful associations between certain clusters and market characteristics such as trading volume, market capitalization, and financial ratios. Moreover, González et al. (2025) show that cryptocurrencies can be categorized into two main clusters: stablecoins and non-stable coins. Their analysis reveals that these subgroups are driven by heterogeneous factors, with up to two global components influencing the overall market, one of which is strongly associated with Bitcoin. Stablecoins, in particular, are influenced by a broader set of determinants compared to standard cryptocurrencies.
4.4 Practical implications for portfolio management and risk control
The clustering results obtained through the DM-MSTP framework offer several actionable insights for real-world portfolio construction and risk management. First, the identification of distinct clusters enables investors to design more diversified portfolios by selecting assets from structurally distant groups within the minimum spanning tree. For instance, combining a core asset from the highly correlated cluster dominated by Bitcoin and Ethereum with assets from peripheral clusters such as emerging or DeFi-oriented tokens (e.g., TON or SUI) and stable coins can significantly reduce overall portfolio risk.
Second, the centrality of certain cryptocurrencies, particularly Bitcoin, highlights their role as systemic risk transmitters. Portfolio managers can use this information to actively monitor hub assets and adjust exposure during periods of heightened market stress. Reducing weight in highly central nodes while increasing allocation to weakly connected assets may improve portfolio resilience during turbulent market conditions.
Third, the stable coin cluster provides a natural hedging and liquidity management tool. Assets such as USDT, USDC, and DAI exhibit minimal correlation with volatile cryptocurrencies and can therefore serve as volatility dampeners or temporary safe havens during market downturns. This insight is particularly relevant for short-term risk management and dynamic rebalancing strategies.
Finally, the DM-MSTP clustering framework can assist institutional investors and regulators in identifying concentration risk and potential contagion channels within the cryptocurrency ecosystem. By tracking structural changes in the MST over time, decision-makers can anticipate periods of increasing market fragility and implement proactive risk mitigation strategies.
4.5 Inherent limitations
Despite the methodological contribution of the DM-MSTP framework, several inherent limitations should be acknowledged. First, the approach relies fundamentally on correlation-based distance measures to construct the minimum spanning tree. While correlations provide a convenient and widely used proxy for asset interdependence, they may become unstable or misleading during extreme market conditions such as financial crises, speculative bubbles, or sudden regulatory shocks. In such environments, correlations tend to increase abruptly, potentially distorting the network structure and reducing the discriminative power of the clustering results.
Second, the DM-MSTP method is sensitive to data quality, particularly in the presence of missing or incomplete observations. Although this study mitigates missing data issues through column-wise averaging, such imputation techniques may smooth asset-specific dynamics and introduce bias, especially for highly volatile or newly listed cryptocurrencies. This limitation could affect the exact positioning of certain nodes within the tree and, consequently, the resulting cluster composition.
Third, the current analysis is based on static correlations computed over the full sample period. As a result, the DM-MSTP framework does not explicitly capture time-varying dependencies or regime shifts that characterize cryptocurrency markets. The static nature of the MST may therefore overlook short-term structural changes or transitional phases between clusters.
Future research avenues include extending the DM-MSTP framework along several complementary dimensions. First, incorporating time-varying or rolling-window dependence structures would allow the model to capture structural changes across different market regimes, particularly during periods of heightened volatility. Second, adopting alternative measures of dependence, such as tail dependence, copula-based metrics, or information-theoretic approaches, could improve the robustness of the network representation beyond linear correlations. Third, more sophisticated techniques for handling missing or irregular data may reduce potential biases arising from data incompleteness. In addition, integrating advanced machine learning models within the network-based framework and conducting systematic comparisons with traditional and hybrid portfolio optimization methods would further assess the adaptability and performance of the DM-MSTP approach under diverse market conditions. Overall, these extensions would strengthen the ability of network-based artificial intelligence models to capture the evolving complexity of cryptocurrency markets and support more resilient investment and risk management strategies.
5 Conclusion
This study introduces the innovative Dhouib Matrix Minimum Spanning Tree Problem (DM-MSTP) approach as an effective and advanced method for analyzing and clustering the cryptocurrency market. By merging the structural perspective of network theory with the adaptive power of artificial intelligence, the DM-MSTP framework provides a clear and comprehensive understanding of how 35 major cryptocurrencies are interconnected. The analysis reveals four distinct clusters, reflecting the diversity of market dynamics ranging from large, highly volatile assets to more stable, low-risk cryptocurrencies. The analysis confirms Bitcoin’s central role as the main transmitter of shocks and information within the network, reinforcing its dominance in shaping market movements. Stablecoins such as USDT, USDC, and DAI show very weak correlations with other assets, validating their function as stabilizing and safe-haven instruments. In contrast, emerging and DeFi-oriented tokens such as NEAR, SUI, and TON appear more independent, offering investors promising opportunities for portfolio diversification and risk mitigation.
From a theoretical perspective, this study enriches the literature on intelligent financial systems by creating a bridge between artificial intelligence and network-based portfolio modeling. Methodologically, the DM-MSTP offers a clear and transparent way to uncover hidden structural relationships within complex financial markets. On a practical level, the identified clusters provide meaningful guidance for investors and portfolio managers, helping them design more balanced and resilient cryptocurrency portfolios by strategically combining assets from different clusters.
Statements
Data availability statement
The original contributions presented in the study are included in the article/supplementary material, further inquiries can be directed to the corresponding author.
Author contributions
SD: Conceptualization, Data curation, Formal Analysis, Methodology, Project administration, Resources, Software, Validation, Visualization, Writing – original draft, Writing – review and editing. HE: Conceptualization, Formal Analysis, Investigation, Resources, Validation, Visualization, Writing – original draft, Writing – review and editing. MA: Conceptualization, Formal Analysis, Investigation, Resources, Validation, Visualization, Writing – original draft, Writing – review and editing. SE: Conceptualization, Formal Analysis, Funding acquisition, Investigation, Project administration, Visualization, Writing – original draft, Writing – review and editing. HC: Conceptualization, Formal Analysis, Visualization, Writing – original draft, Writing – review and editing.
Funding
The author(s) declared that financial support was not received for this work and/or its publication.
Conflict of interest
The author(s) declared that this work was conducted in the absence of any commercial or financial relationships that could be construed as a potential conflict of interest.
Generative AI statement
The author(s) declared that generative AI was not used in the creation of this manuscript.
Any alternative text (alt text) provided alongside figures in this article has been generated by Frontiers with the support of artificial intelligence and reasonable efforts have been made to ensure accuracy, including review by the authors wherever possible. If you identify any issues, please contact us.
Publisher’s note
All claims expressed in this article are solely those of the authors and do not necessarily represent those of their affiliated organizations, or those of the publisher, the editors and the reviewers. Any product that may be evaluated in this article, or claim that may be made by its manufacturer, is not guaranteed or endorsed by the publisher.
References
1
AlnamiH.MohzaryM.AssiriB.ZangotiH. (2025). An integrated framework for cryptocurrency price forecasting and anomaly detection using machine learning. Appl. Sci.15 (4), 1864. 10.3390/app15041864
2
AlsiniI. M.ElzeinA.BenameurB.BrahimB.AlqurashiA. A.MashatM. D.et al (2024). Forecasting cryptocurrency's buy signal with a bagged tree learning approach to enhance purchase decisions. Front. Big Data7, 1369895. 10.3389/fdata.2024.1369895
3
BerouagaY.El MsiyahC.MadkourJ. (2023). Portfolio optimization using minimum spanning tree model in the Moroccan stock exchange market. Int. J. Financial Stud.11 (2), 53. 10.3390/finance11020053
4
ChenC.LuoP.JailletP. (2025). Portfolio optimization based on almost second-degree stochastic dominance. Manag. Sci.71 (8), 7029–7055. 10.1287/mnsc.2024.00416
5
CorbetS.MeeganA.LarkinC.LuceyB.YarovayaL. (2018). Exploring the dynamic relationships between cryptocurrencies and other financial assets. Econ. Letters165, 28–34. 10.1016/j.econlet.2018.01.004
6
DhouibS. (2024). Innovative method to solve the minimum spanning tree problem: the Dhouib-Matrix-MSTP (DM-MSTP). Results Control Optim.14, 100359. 10.1016/j.rico.2023.100359
7
DhouibS. (2025a). Innovative technique with enriched movement directions to plan the trajectory for an autonomous mobile robot. Sci. Prog.108 (1), 1–19. 10.1177/00368504251321714
8
DhouibS. (2025b). Minimizing the drilling robot arm movement by the advanced Dhouib-Matrix-4 metaheuristic. Concurrent Eng. Res. Appl.33 (1), 1–13. 10.1177/1063293X241311734
9
DhouibS. (2026). Fast method for the Mobile robot path planning problem: the DM-SPP method. Statistics. Optim. and Inf. Comput.15 (1), 516–528. 10.19139/soic-2310-5070-3013
10
DhouibS.VidhyaK.BroumiS.TaleaM. (2024). Solving the minimum spanning tree problem under interval valued fermatean neutrosophic domain. Neutrosophic Sets Syst.67, 11–20. Available online at: https://digitalrepository.unm.edu/nss_journal/vol67/iss1/2
11
DhouibS.KharratA.LoukilT.ChabchoubH. (2025a). Optimizing the hexagonal fuzzy transportation problem with the novel Dhouib-Matrix-TP1 method. Adv. Fuzzy Syst.2025, 3152445. 10.1155/adfs/3152445
12
DhouibS.MilediM.LoukilT. (2025b). Unraveling the intuitionistic octagonal fuzzy travelling salesman problem via Dhouib-Matrix-TSP1 heuristic. Statistics. Optim. and Inf. Comput.13 (3), 1046–1062. 10.19139/soic-2310-5070-2150
13
GonzálezL. M.CerquetiR.MatteraR.GraneroM. Á. S.SegoviaJ. E. T. (2025). Analyzing clustered factors in the cryptocurrency market with random matrix theory. Phys. A Stat. Mech. Its Appl.665, 130473. 10.1016/j.physa.2025.130473
14
JingT. (2023). Risk management strategies in decentralized finance: a minimum spanning tree approach. Quant. Finance Lett.11 (1), 1–15.
15
JingR.RochaL. E. C. (2023). A network-based strategy of price correlations for optimal cryptocurrency portfolios. Finance Res. Lett.58, 104503. 10.1016/j.frl.2023.104503
16
KoutmosD. (2018). Return and volatility spillovers among cryptocurrencies. Econ. Lett.173, 122–127. 10.1016/j.econlet.2018.10.004
17
KurosakiT.KimY. S. (2022). Cryptocurrency portfolio optimization with multivariate normal distribution. Finance Res. Lett.45, 102143. 10.1016/j.frl.2021.102143
18
KwapieńJ.OświecimkaP.StanuszekM. (2020). Minimum spanning tree structures in the cryptocurrency market. Entropy22 (12), 1361.
19
KwapieńJ.WątorekM.DrożdżS. (2021). Cryptocurrency market consolidation in 2020–2021. Entropy23 (12), 1674. 10.3390/e23121674
20
LorenzoL.ArroyoJ. (2022). Analysis of the cryptocurrency market using different prototype-based clustering techniques. Financ. Innov.8 (1), 7. 10.1186/s40854-021-00310-9
21
MantegnaR. N. (1999). Hierarchical structure in financial markets. Eur. Phys. J. B11 (1), 193–197. 10.1007/s100510050929
22
NaifarN.MakniM. S. (2025). Dynamics of cryptocurrencies, DeFi tokens, and tech stocks: lessons from the FTX collapse. Int. J. Financial Stud.13 (3), 169. 10.3390/ijfs13030169
23
OnnelaJ. P.ChakrabortiA.KaskiK.KertészJ.KantoA. (2003). Dynamics of market correlations: taxonomy and portfolio analysis. Phys. Rev. E68 (5), 056110. 10.1103/PhysRevE.68.056110
24
PozziF.Di MatteoT.AsteT. (2013). Spread of risk across financial markets: better to invest in the periphery?Sci. Rep.3, 1665. 10.1038/srep01665
25
SahuS.Ochoa VázquezJ. H.RamírezA. F.KimJ. M. (2024). Analyzing portfolio optimization in cryptocurrency markets: a comparative study of short-term investment strategies using hourly data approach. J. Risk Financial Manag.17 (3), 125. 10.3390/jrfm17030125
26
SensoyA.TabakB. M. (2022). Connectedness and clustering in the cryptocurrency market. Phys. A Stat. Mech. Its Appl.586, 126484.
27
SensoyA.SilvaT. C.CorbetS.TabakB. M. (2021). High-frequency return and volatility spillovers among cryptocurrencies. Appl. Econ.53 (37), 4310–4328. 10.1080/00036846.2021.1899119
28
TumminelloM.LilloF.MantegnaR. N. (2010). Correlation, hierarchies, and networks in financial markets. J. Econ. Dyn. Control34 (11), 2010–2031. 10.1016/j.jedc.2010.06.004
Summary
Keywords
artificial intelligence in finance, currency market, financial innovation, metaheuristic, minimum spanning tree problem, operations research, optimization
Citation
Dhouib S, Ezzine H, Abdelhedi M, Ellouz S and Chabchoub H (2026) Clustering cryptocurrencies market through the innovative DM-MSTP method. Front. Blockchain 9:1744921. doi: 10.3389/fbloc.2026.1744921
Received
12 November 2025
Revised
25 December 2025
Accepted
06 March 2026
Published
02 April 2026
Volume
9 - 2026
Edited by
Marcelle MGM Kress Von Wendland, Bancstreet Capital Partners Ltd., United Kingdom
Reviewed by
Shalini Singh, Christ University, India
Steve Springer Laryea, Kumasi Polytechnic, Ghana
Updates
Copyright
© 2026 Dhouib, Ezzine, Abdelhedi, Ellouz and Chabchoub.
This is an open-access article distributed under the terms of the Creative Commons Attribution License (CC BY). The use, distribution or reproduction in other forums is permitted, provided the original author(s) and the copyright owner(s) are credited and that the original publication in this journal is cited, in accordance with accepted academic practice. No use, distribution or reproduction is permitted which does not comply with these terms.
*Correspondence: Souhail Dhouib, souhail.dhouib@gmail.com
Disclaimer
All claims expressed in this article are solely those of the authors and do not necessarily represent those of their affiliated organizations, or those of the publisher, the editors and the reviewers. Any product that may be evaluated in this article or claim that may be made by its manufacturer is not guaranteed or endorsed by the publisher.